swarmvault graph serve
Start a local HTTP server with an interactive graph visualization.
Usage
swarmvault graph serve [--port <port>] [--full]Options
--port <port>— Port override (default: from config, usually 4123)--full— Disable overview sampling and render the full graph canvas even for very large graphs
What It Does
- Starts an HTTP server serving the graph viewer app
- Exposes
/api/graphendpoint returning the viewer-ready graph presentation forstate/graph.json - Exposes
/api/search,/api/page,/api/asset,/api/reviews,/api/review,/api/candidates,/api/candidate,/api/memory-tasks,/api/watch-status,/api/doctor,/api/retrieval/repair,/api/context-pack,/api/task,/api/source/reload,/api/graph-report,/api/graph/query,/api/graph/path,/api/graph/explain,/api/clip, and/api/bookmarklet - Serves an interactive Cytoscape-based visualization plus a health workbench, search, preview, graph query tools, visual-output assets, candidate and approval panels, task history, surprising-connection actions, and group-pattern details
When the compiled graph exceeds 5,000 nodes, the viewer automatically enters overview mode and samples the canvas down to the most important communities and bridge points. The canonical graph artifacts stay unchanged. Use --full if you explicitly want the full canvas rendered anyway.
The standard global CLI install already includes the viewer assets. You do not need to install @swarmvaultai/viewer separately to use this command.
The workbench renders prioritized swarmvault doctor recommendations, every doctor check with details, copyable suggested commands, safe one-click retrieval repair, selectable capture modes (ingest, normalized add, or inbox), title/tag capture fields, editable token budgets for context packs and task starts, and action receipts after workbench operations complete.
graph serve also prints a browser-clipper URL. /api/bookmarklet serves a drag-to-bookmarks link that posts the current browser URL, document title, and selected text to /api/clip. The same endpoint accepts URL-only clips, selected text, markdown, HTML excerpts, and tags. Text or markdown clips are written into the inbox and imported immediately; URL-only bookmarklet clips use the normalized add path.
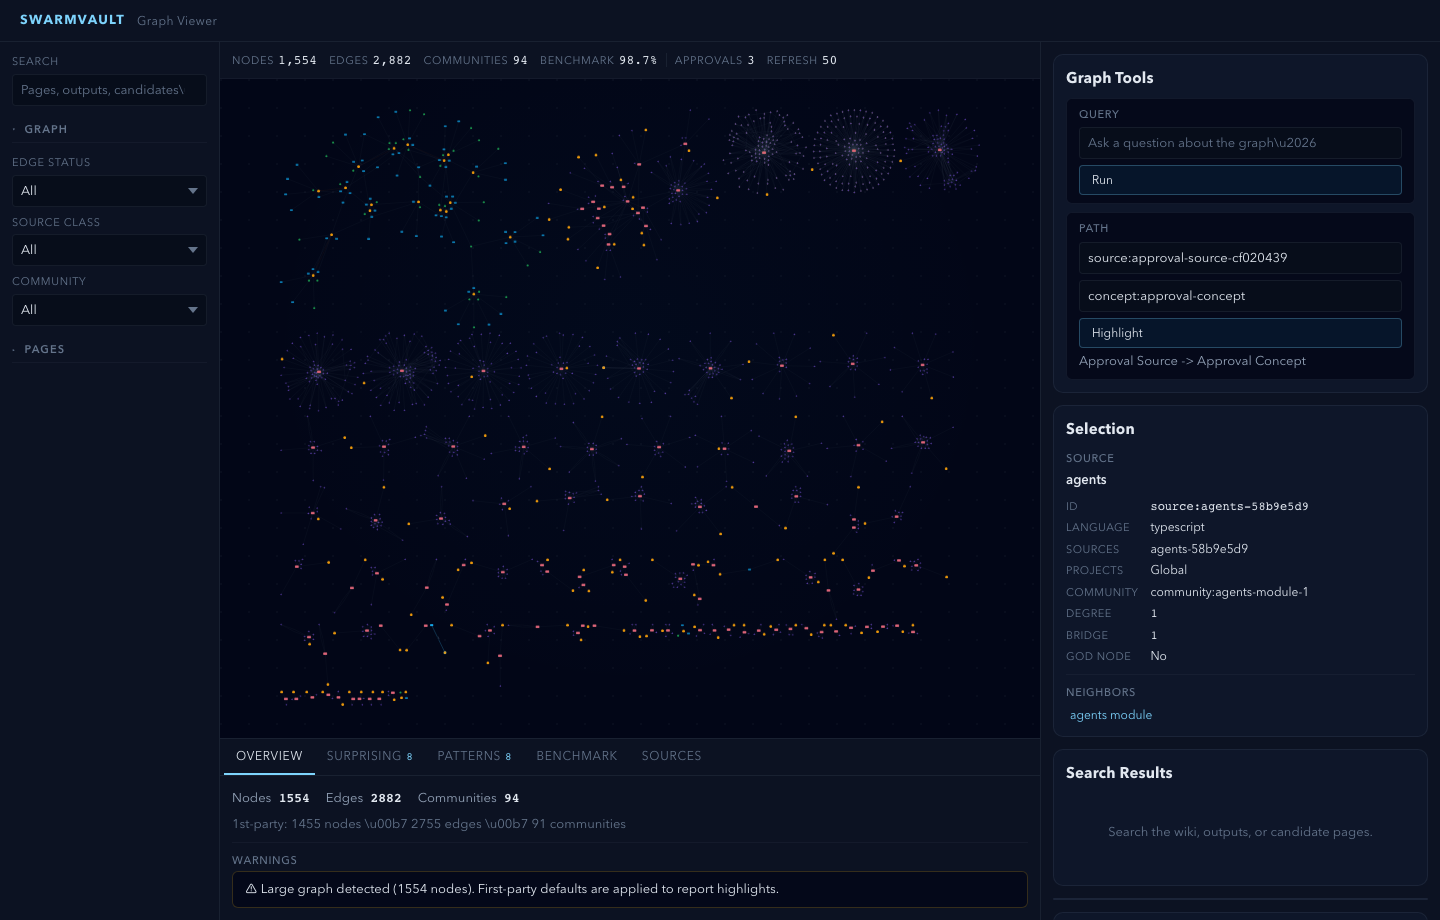
Node Colors
- Orange — Source nodes
- Pink — Module nodes
- Purple — Symbol nodes
- Teal — Rationale nodes
- Blue — Concept nodes
- Green — Entity nodes
- Amber — Task and decision nodes
Workspace Filters
- Edge status:
all,extracted,inferred,conflicted,stale - Community:
allor one compiled graph community - Page kind:
all,source,module,concept,entity,output,insight,memory_task,index - Page status:
all,draft,candidate,active,blocked,completed,archived - Project scope:
all,unassigned, or a configured project id - Source type:
all,untyped,arxiv,doi,article,tweet, orurl - Source class:
all,first_party,third_party,resource, orgenerated
The preview panel can also follow backlinks and related pages, reopening the page and recentering the graph when a node exists. Saved chart and image outputs render their local assets inline through /api/asset.
The live workspace also links to the generated graph-orientation pages under wiki/graph/, including wiki/graph/report.md, wiki/graph/share-card.md, wiki/graph/share-card.svg, wiki/graph/share-kit/, wiki/graph/report.json, and per-community summary pages. It surfaces the latest benchmark freshness state plus clickable surprising connections and group patterns from the graph report, and node inspection now includes group-pattern membership alongside neighbors and provenance. The workbench health strip is backed by swarmvault doctor, so graph, retrieval, review, watch, migration, source, and task warnings are visible before a deeper graph session.